

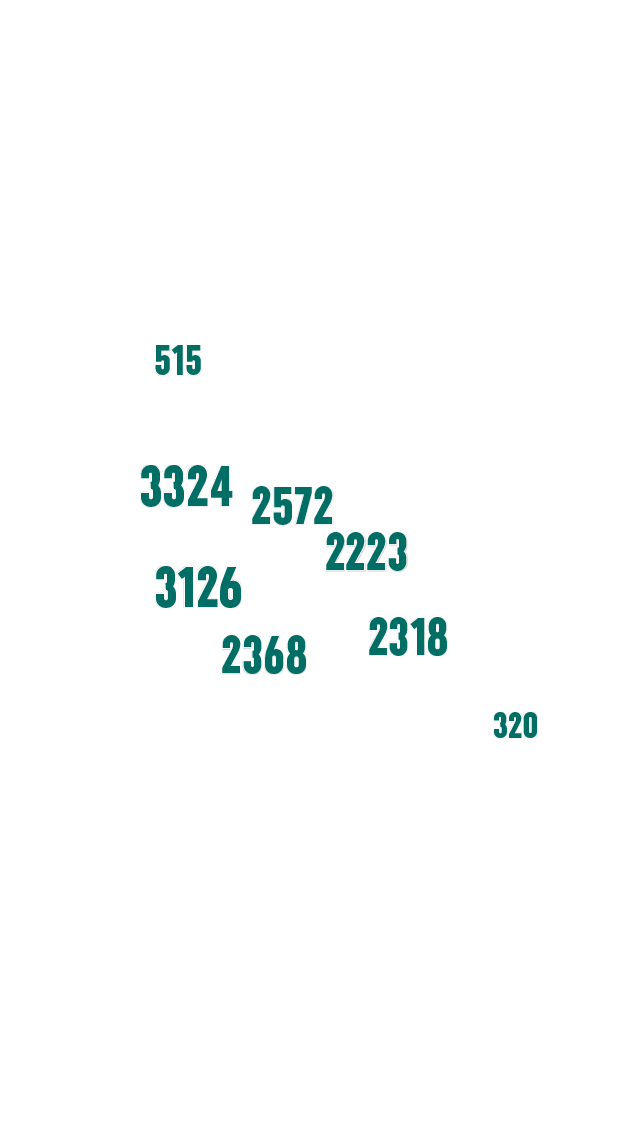
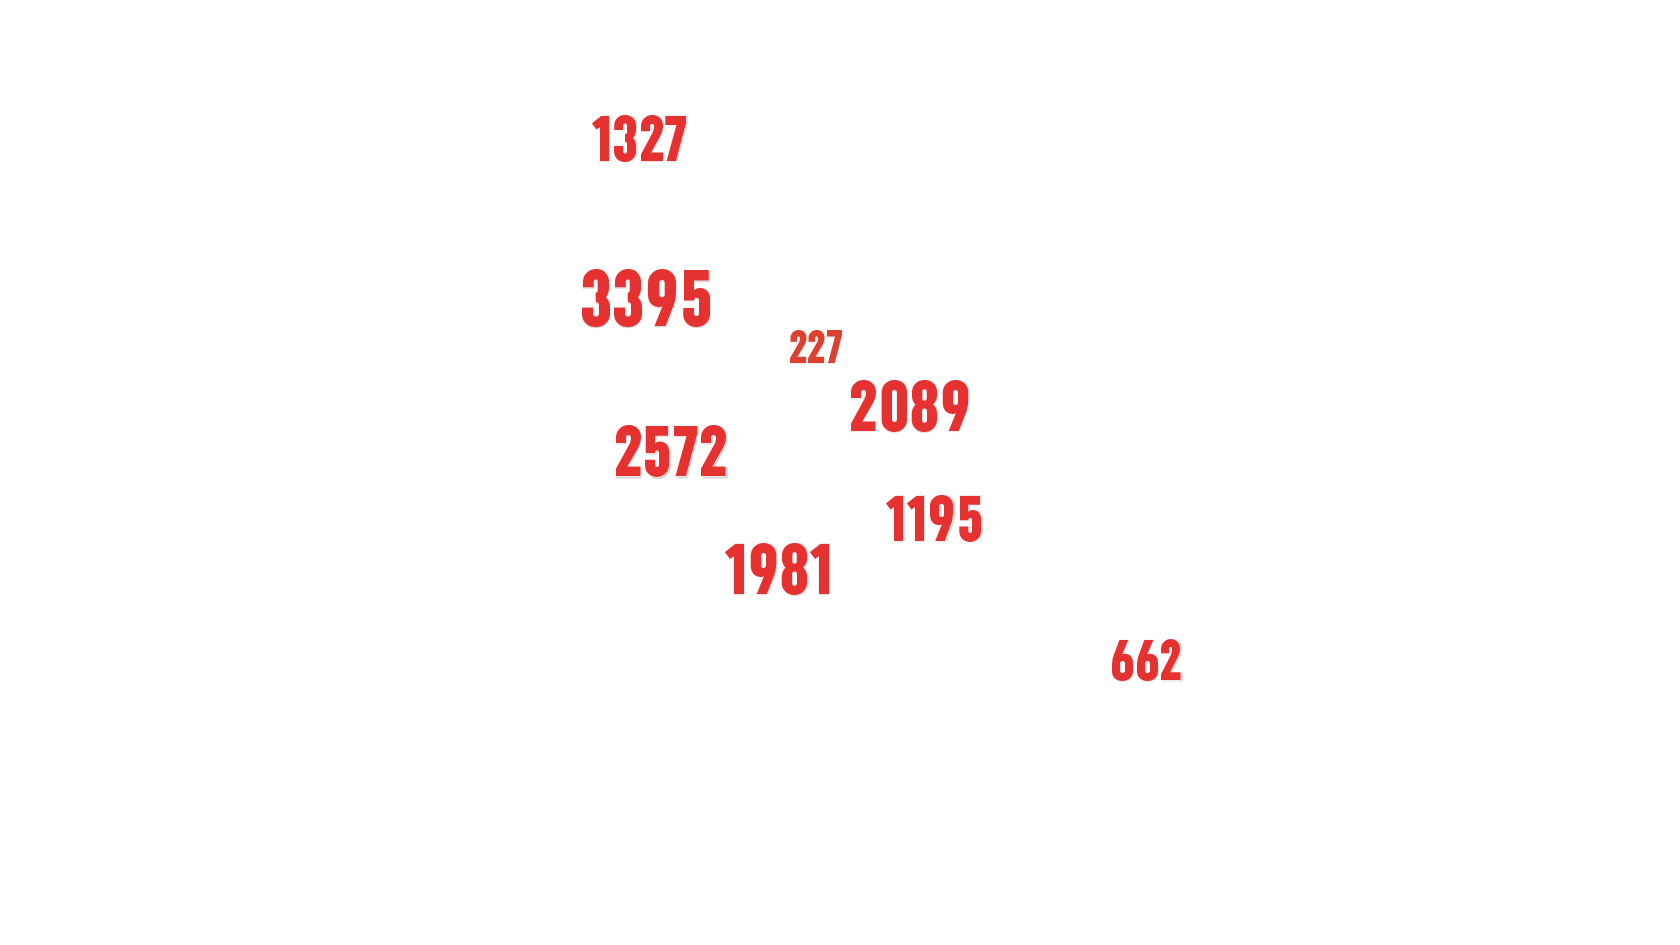
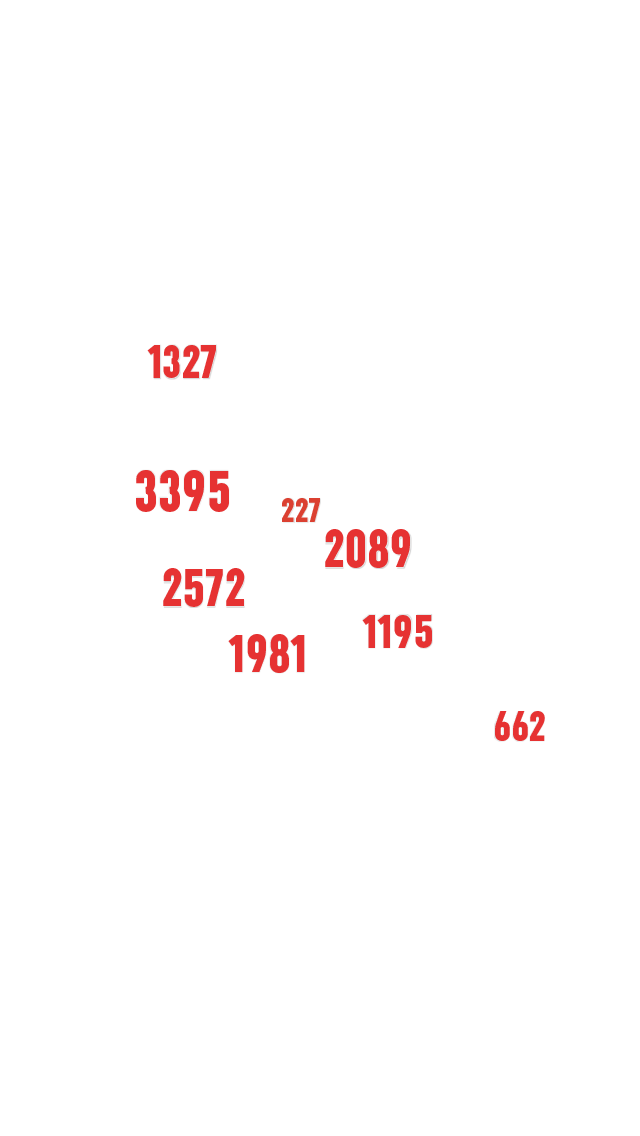


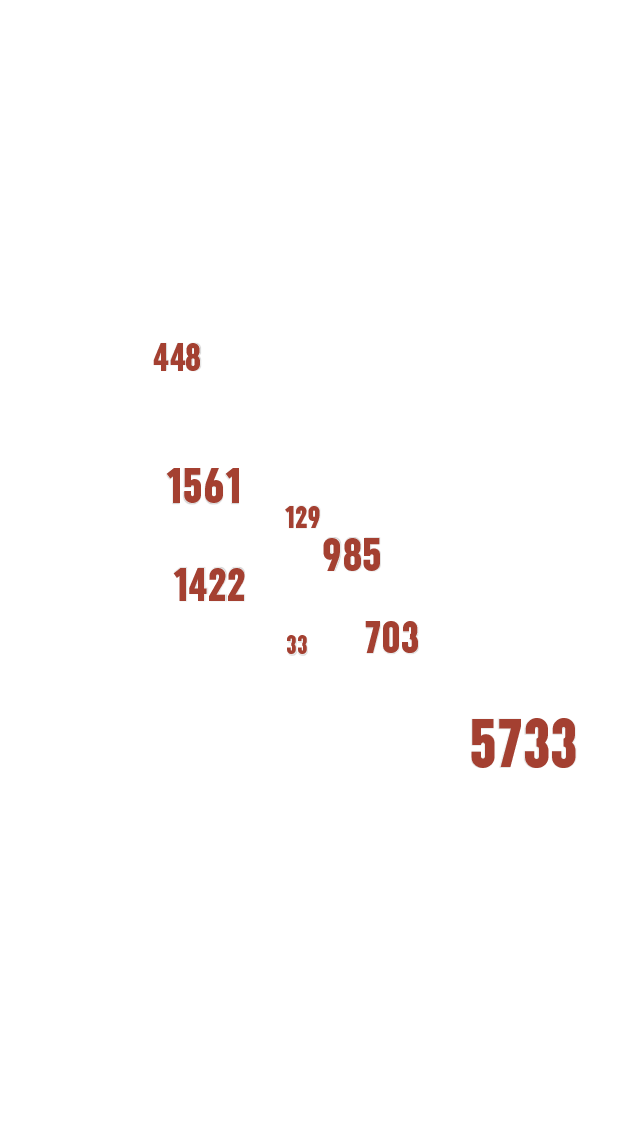
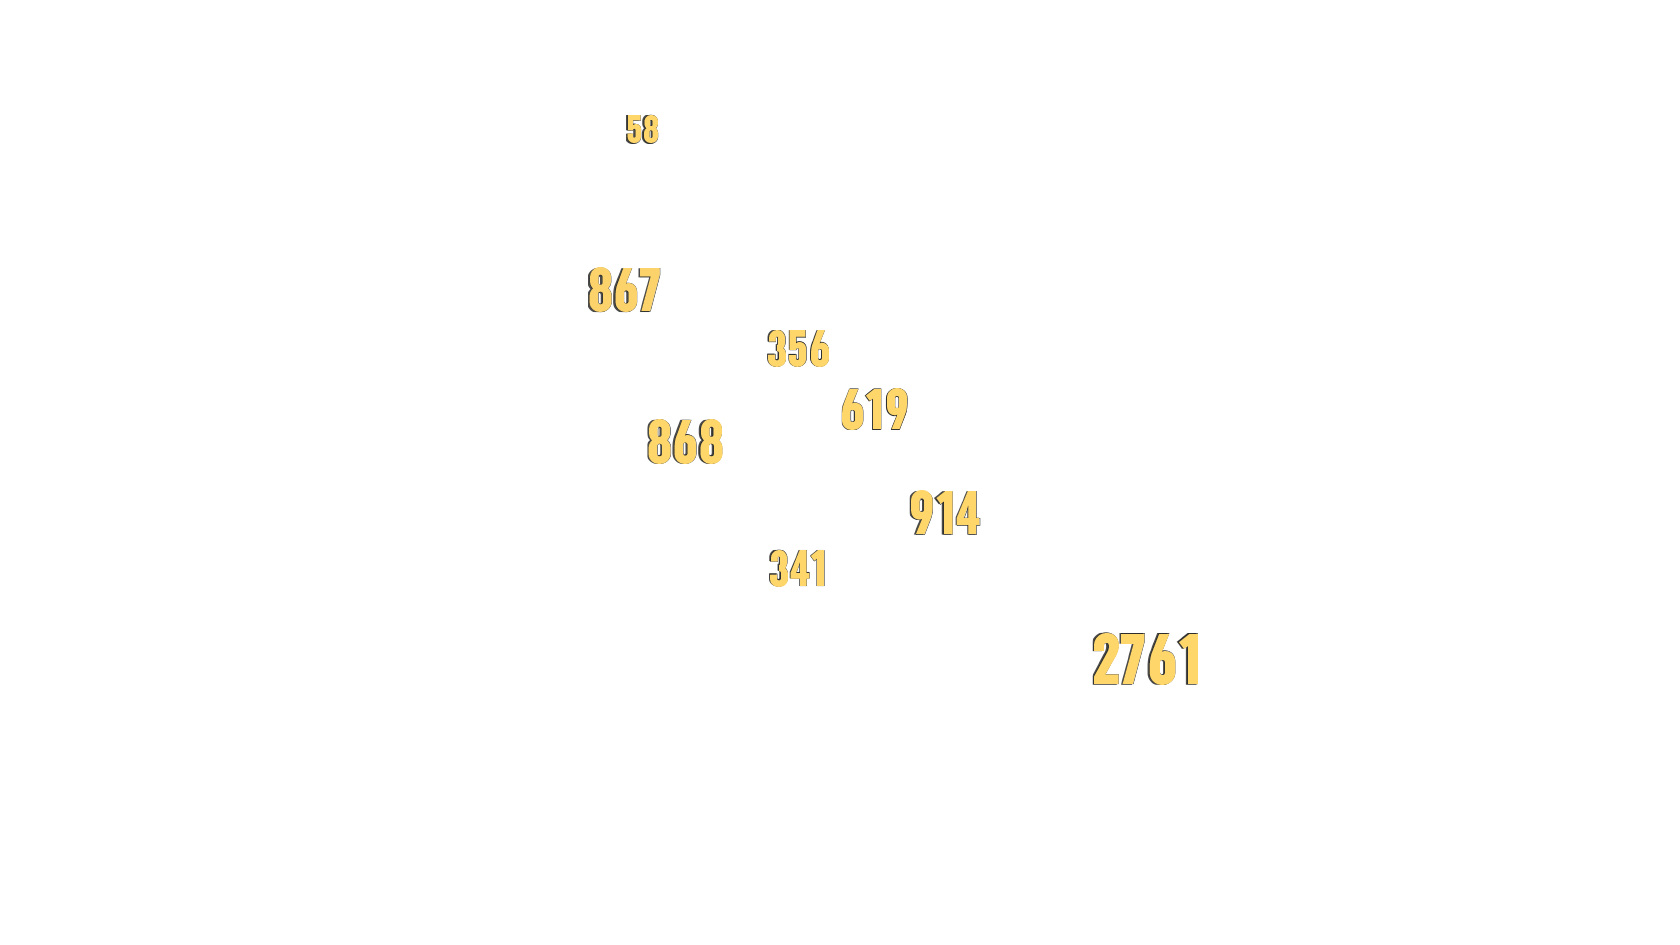
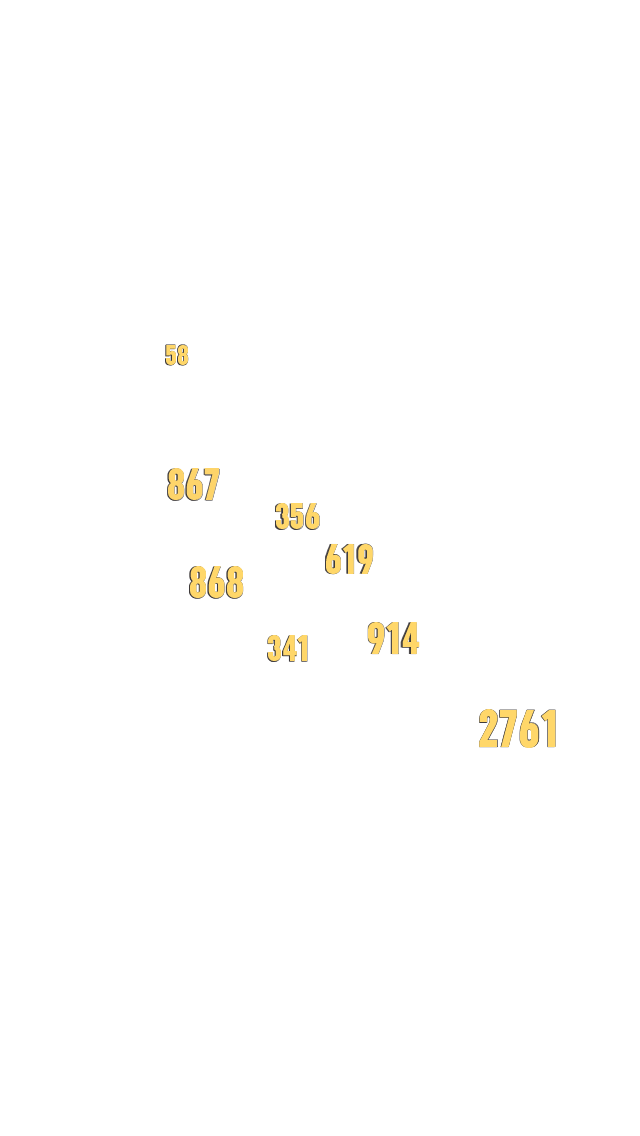
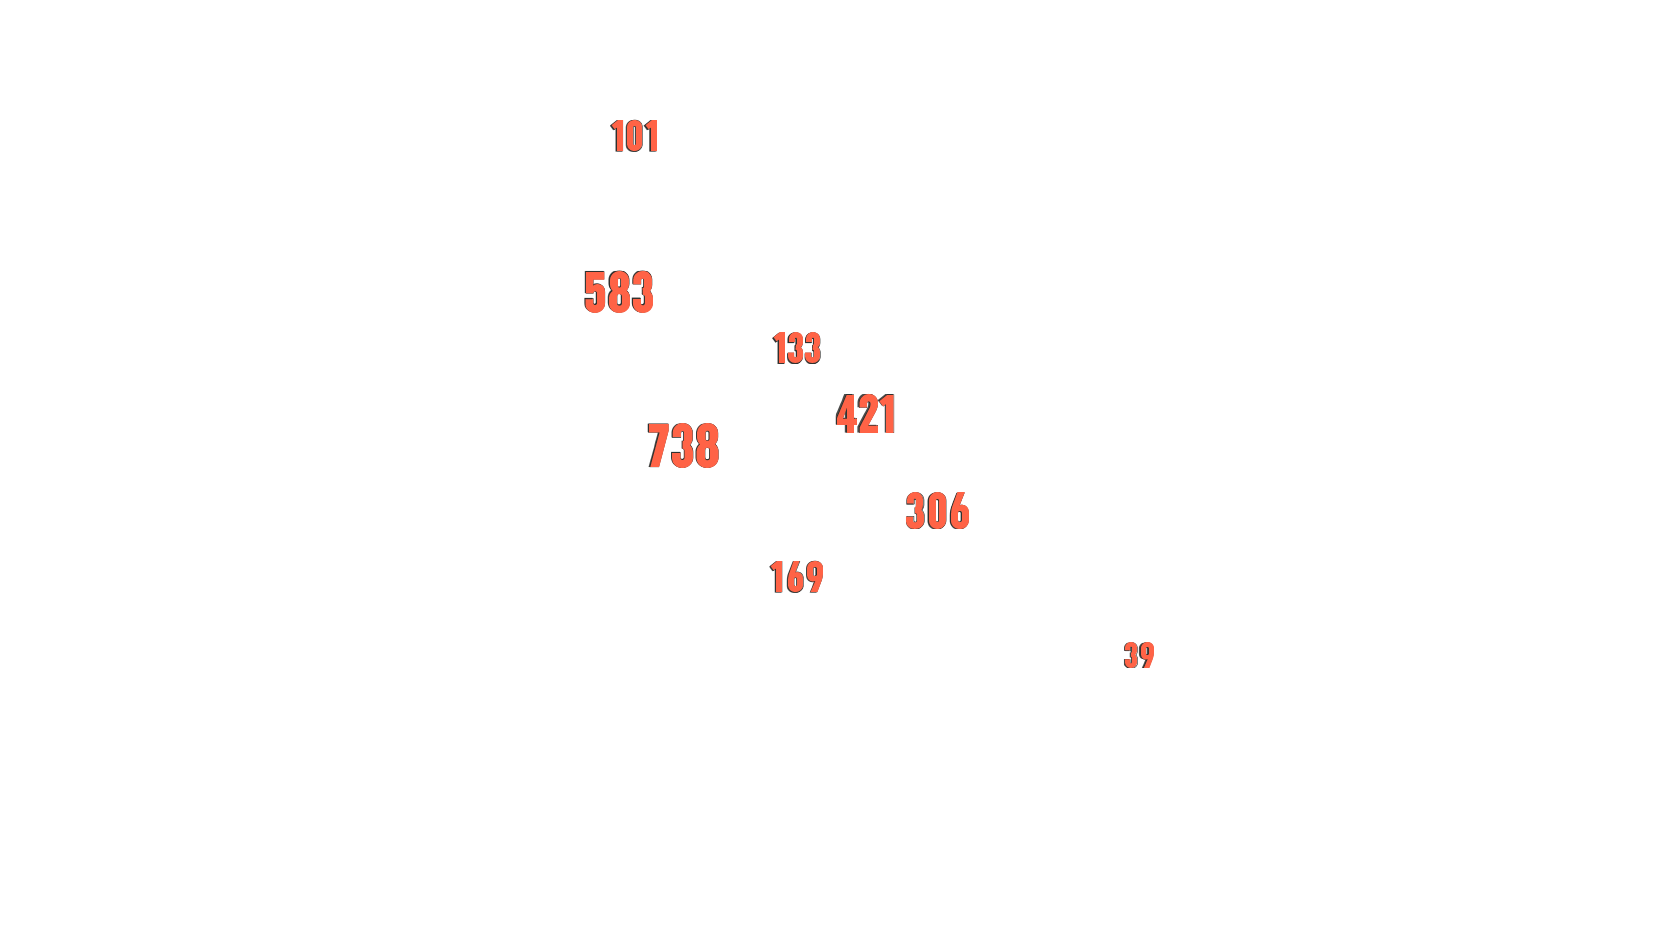
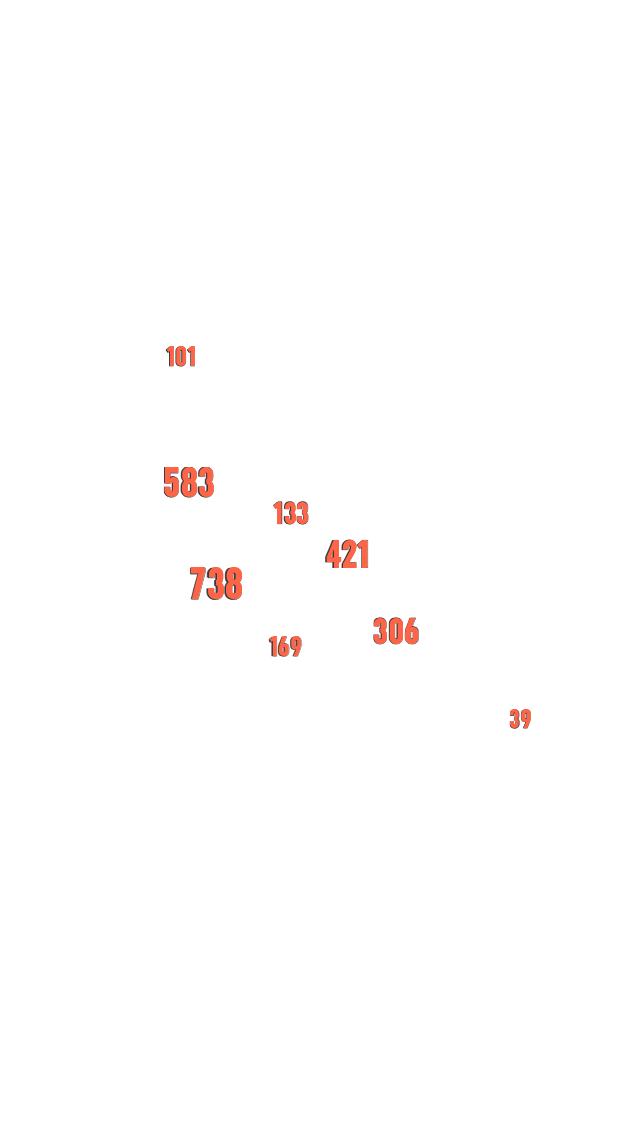
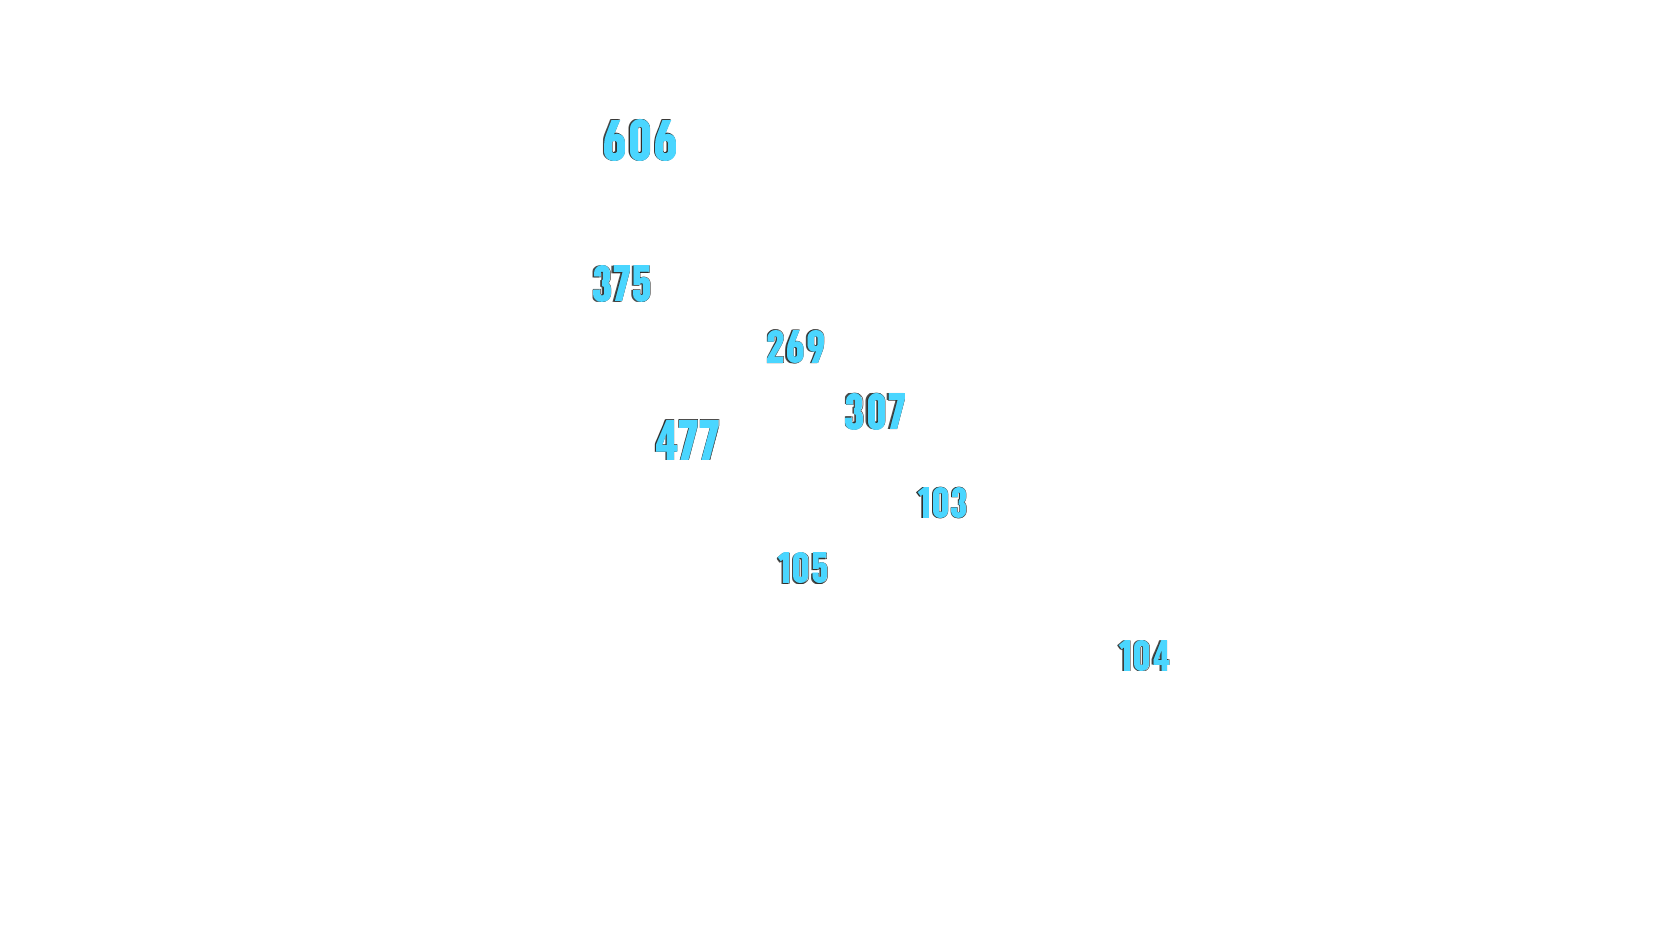
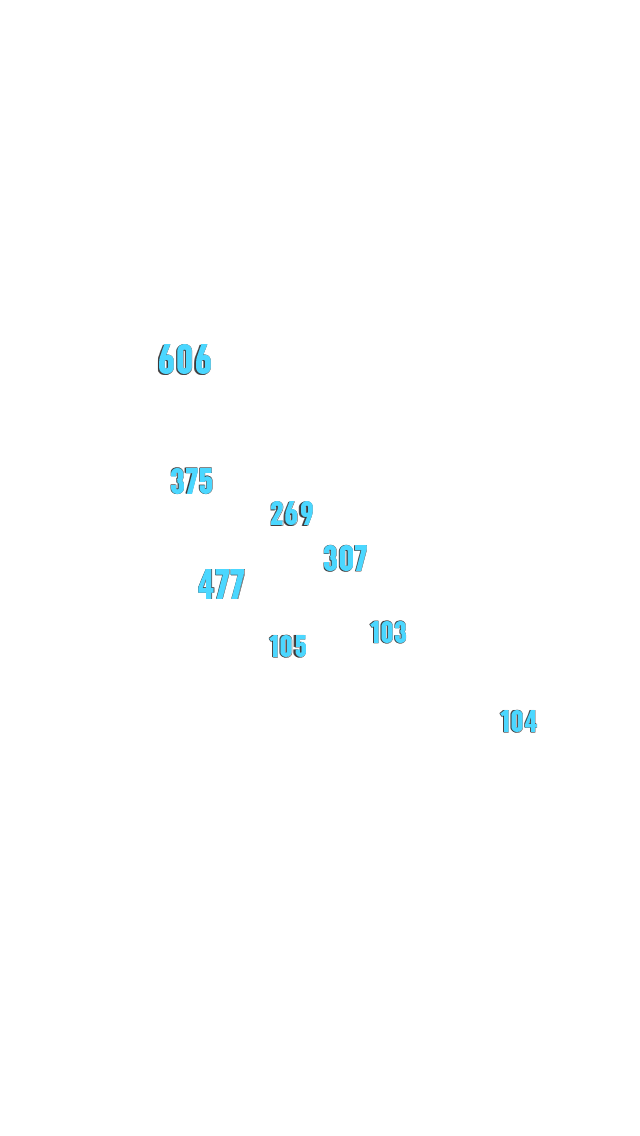
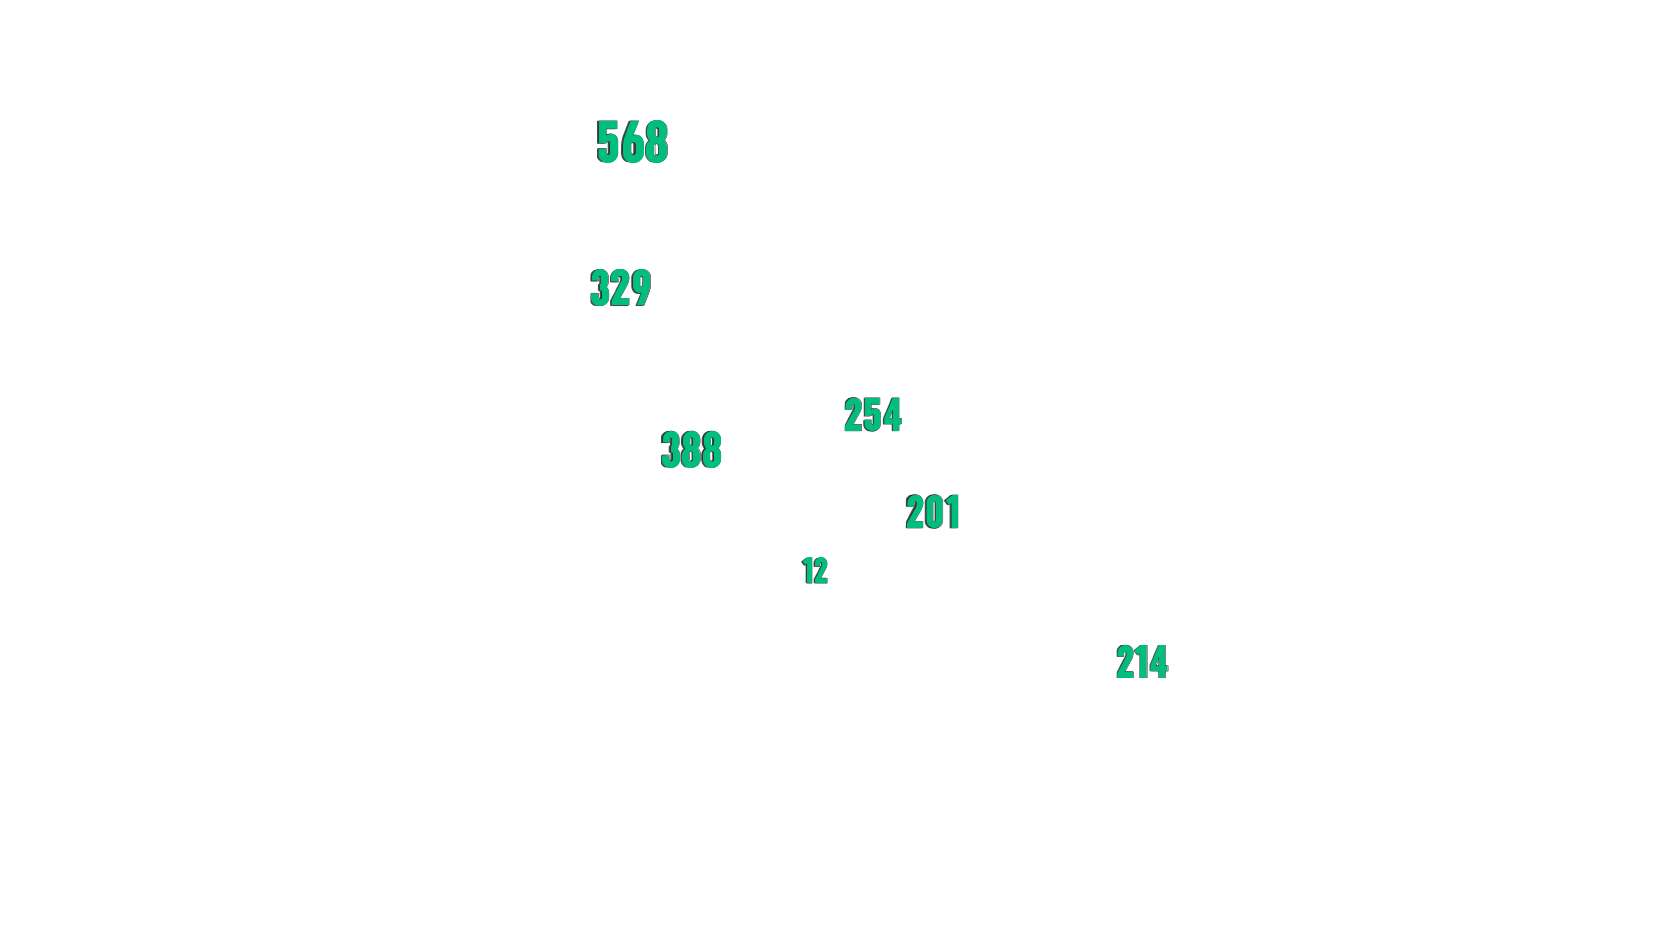
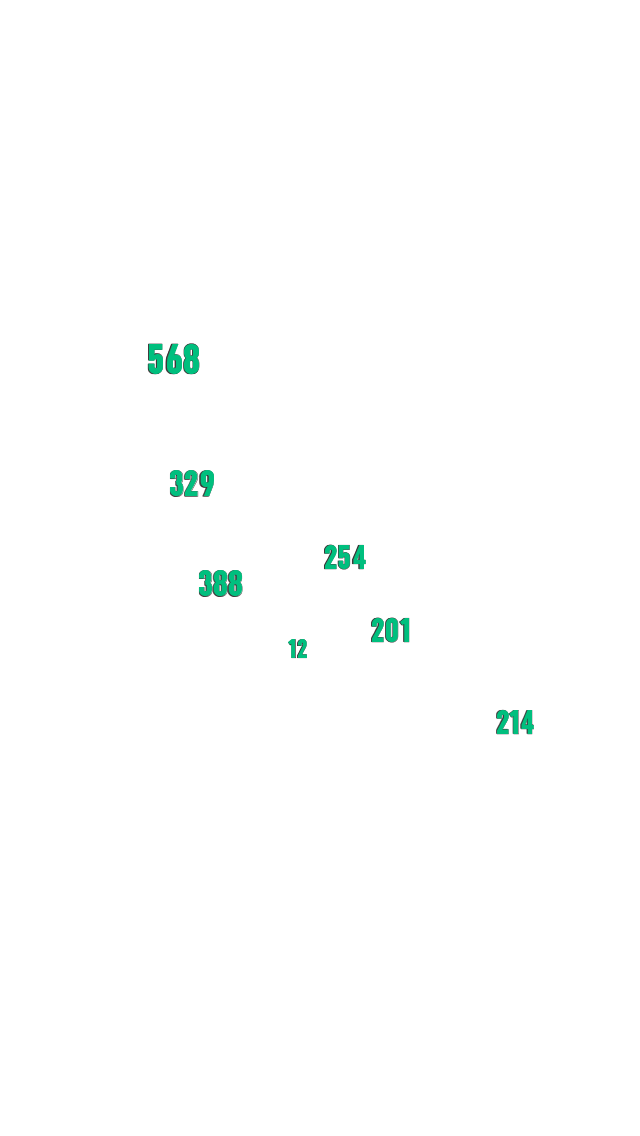
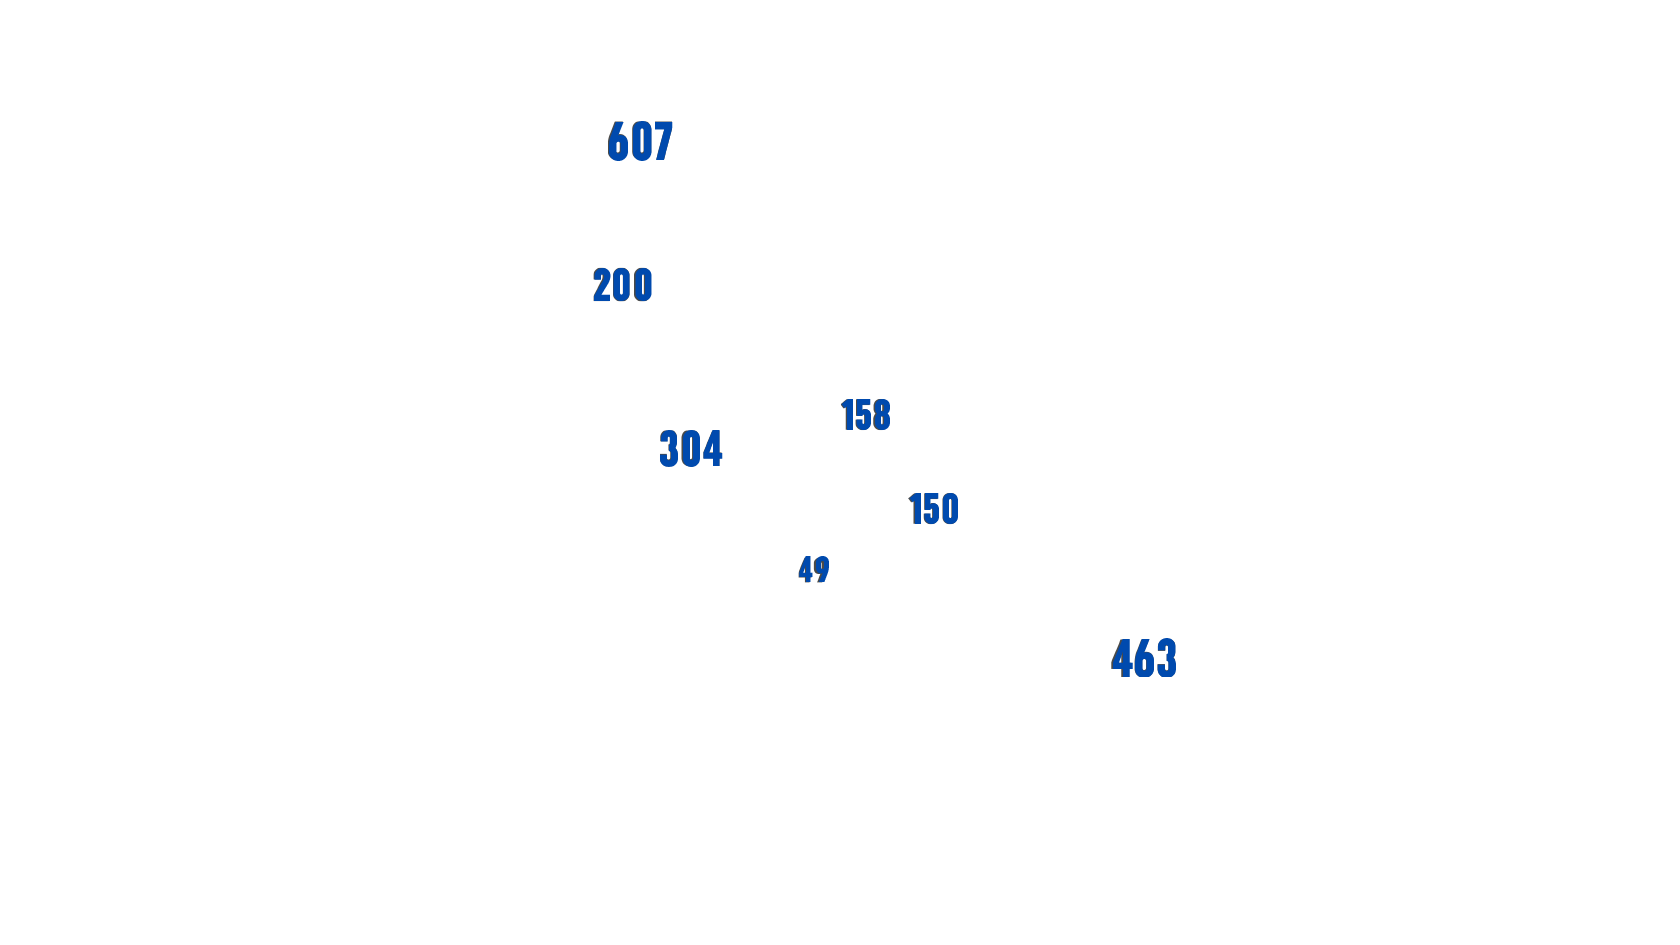
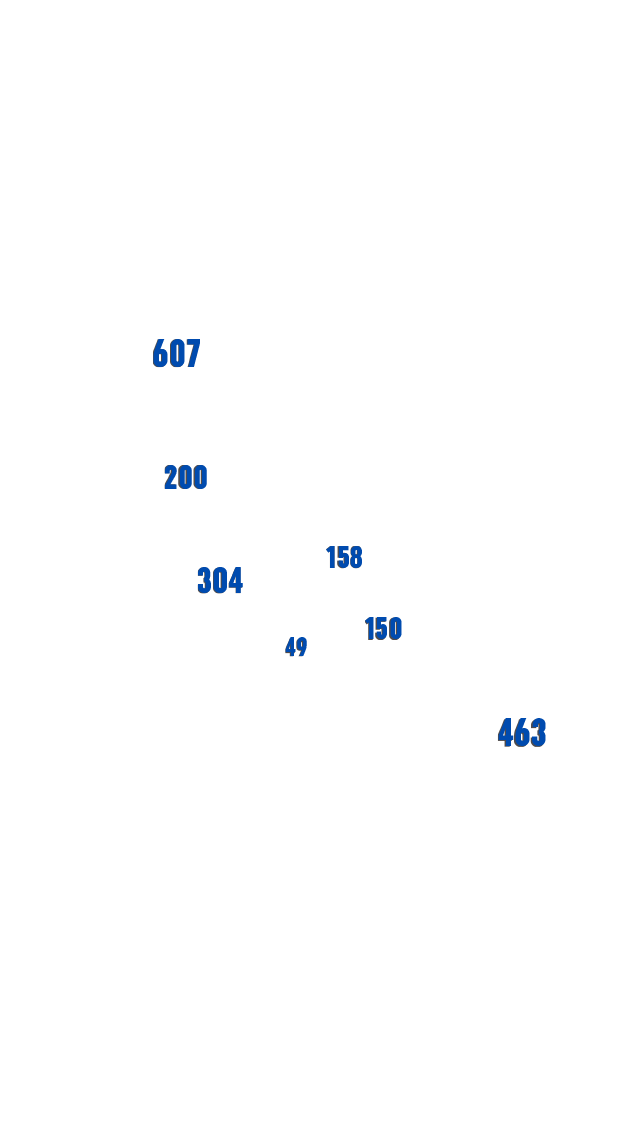
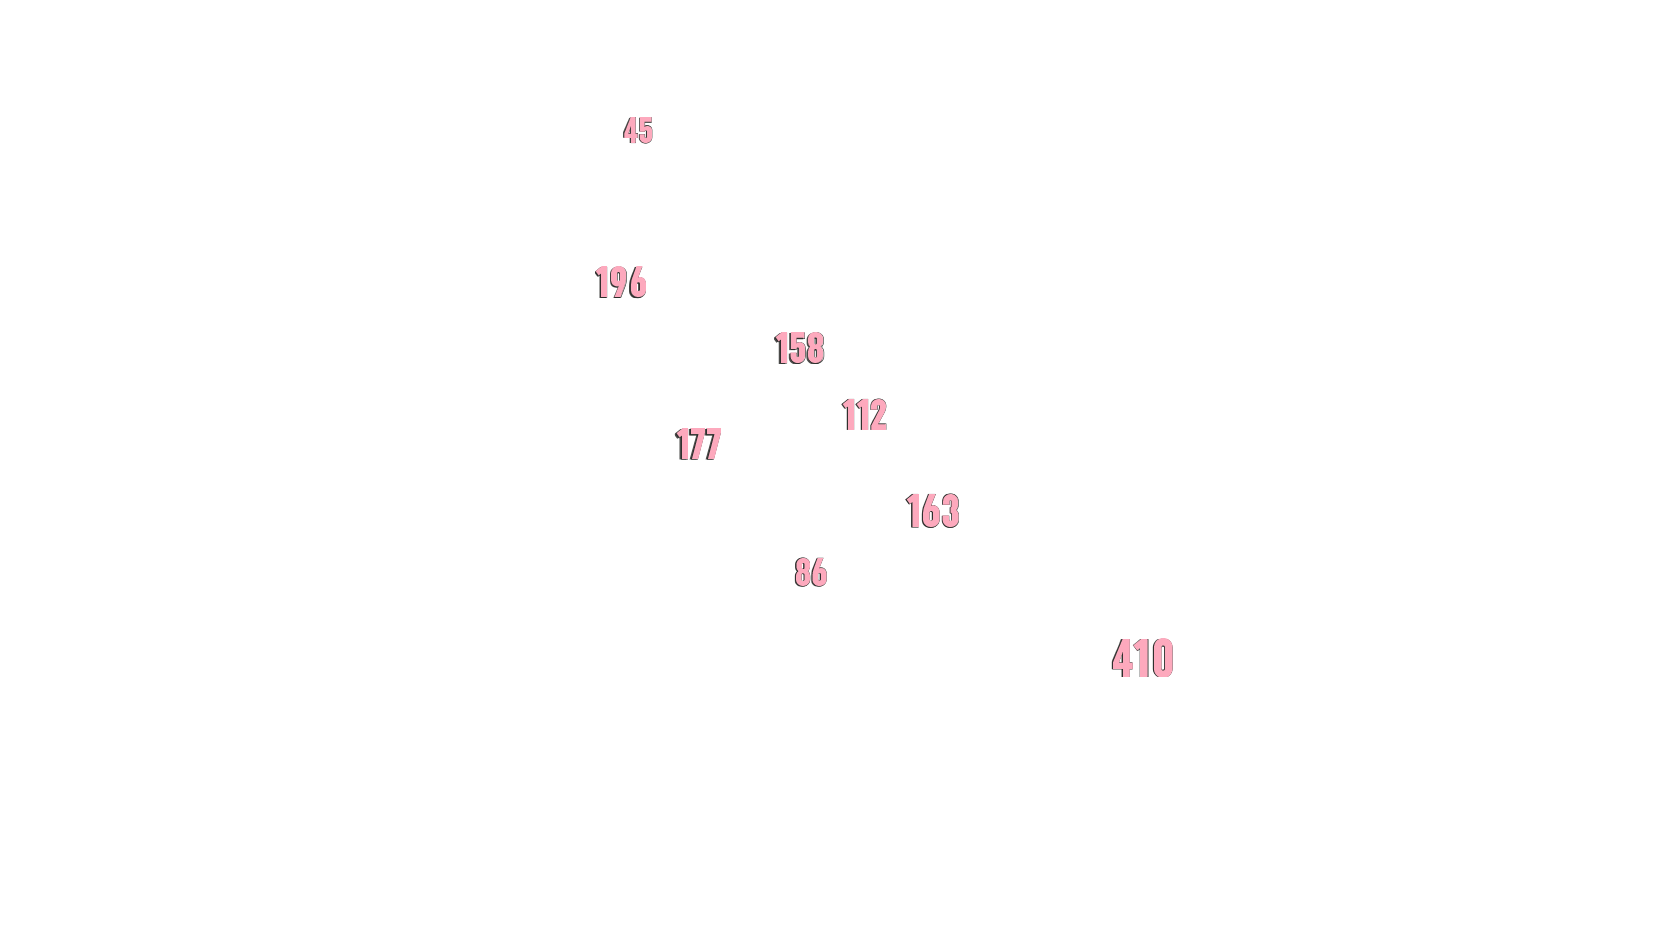
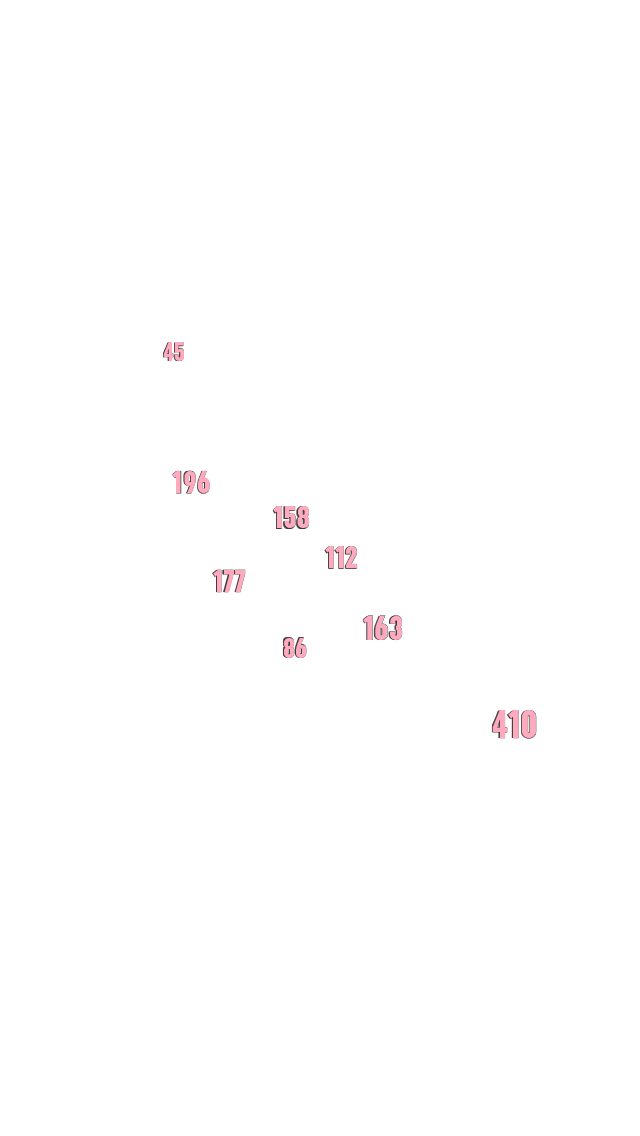
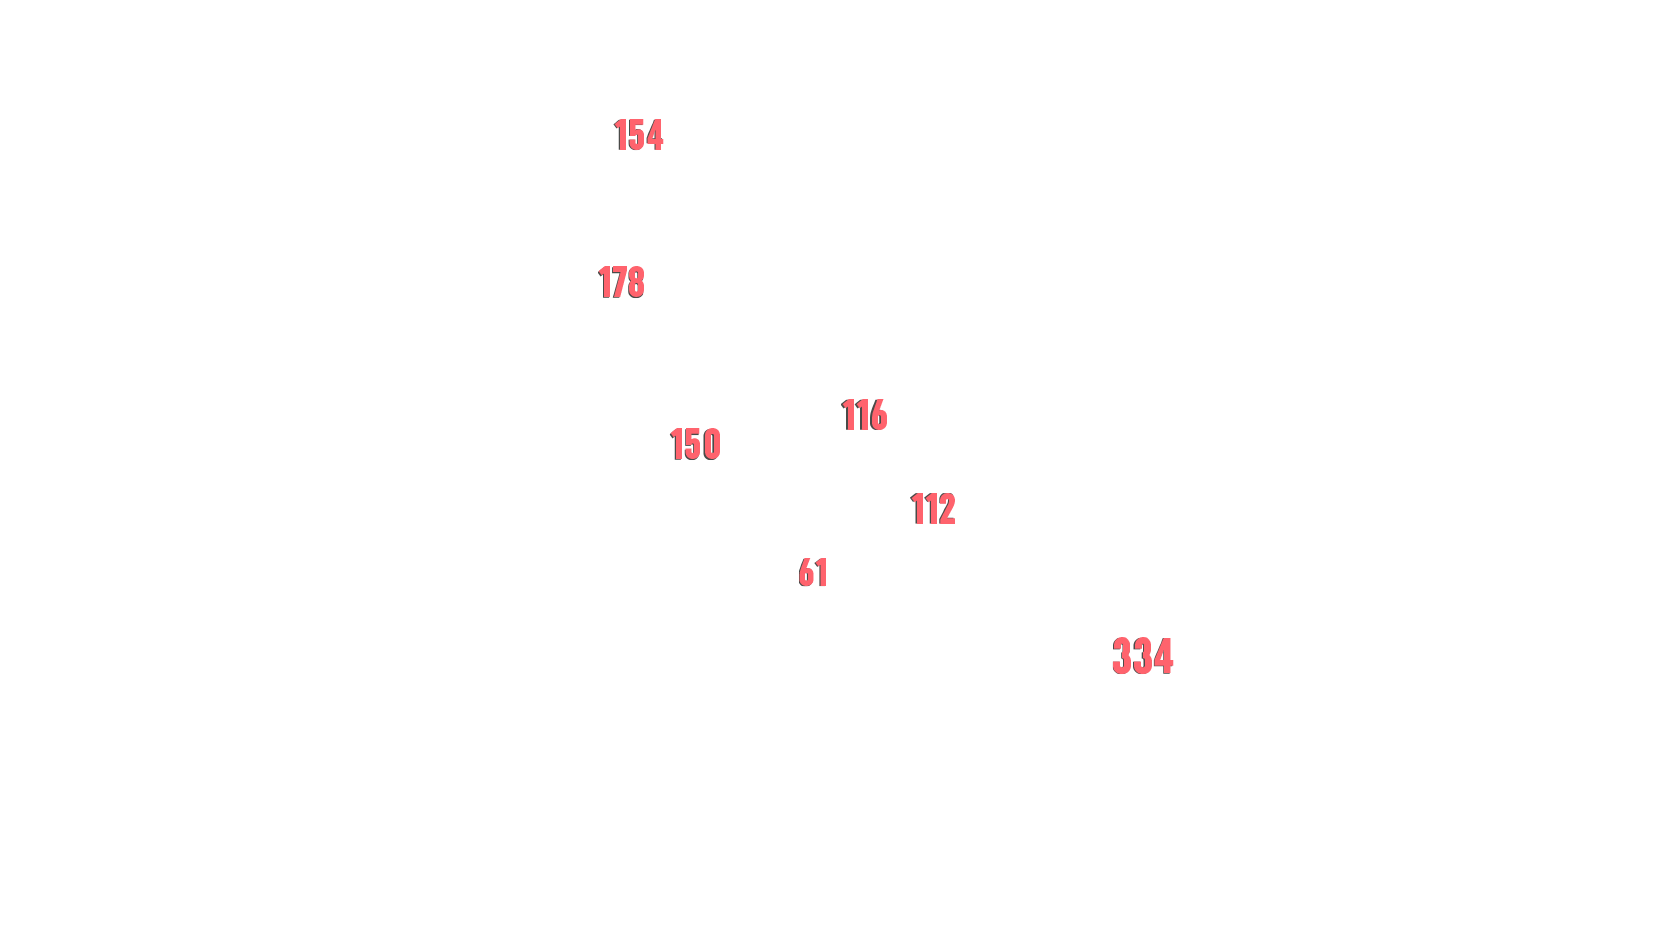
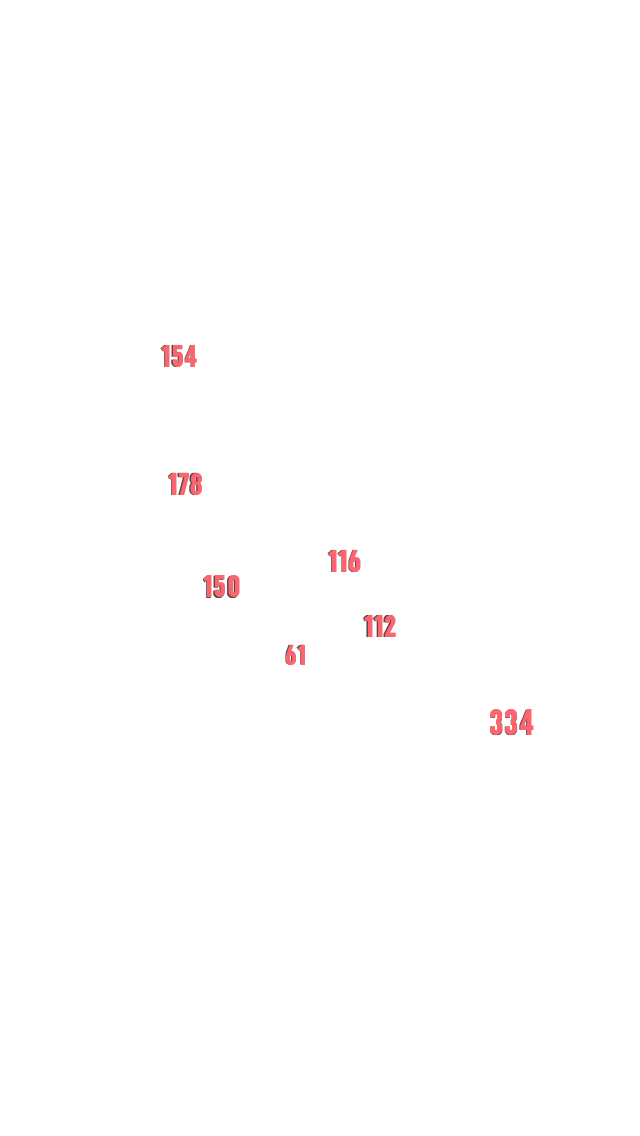
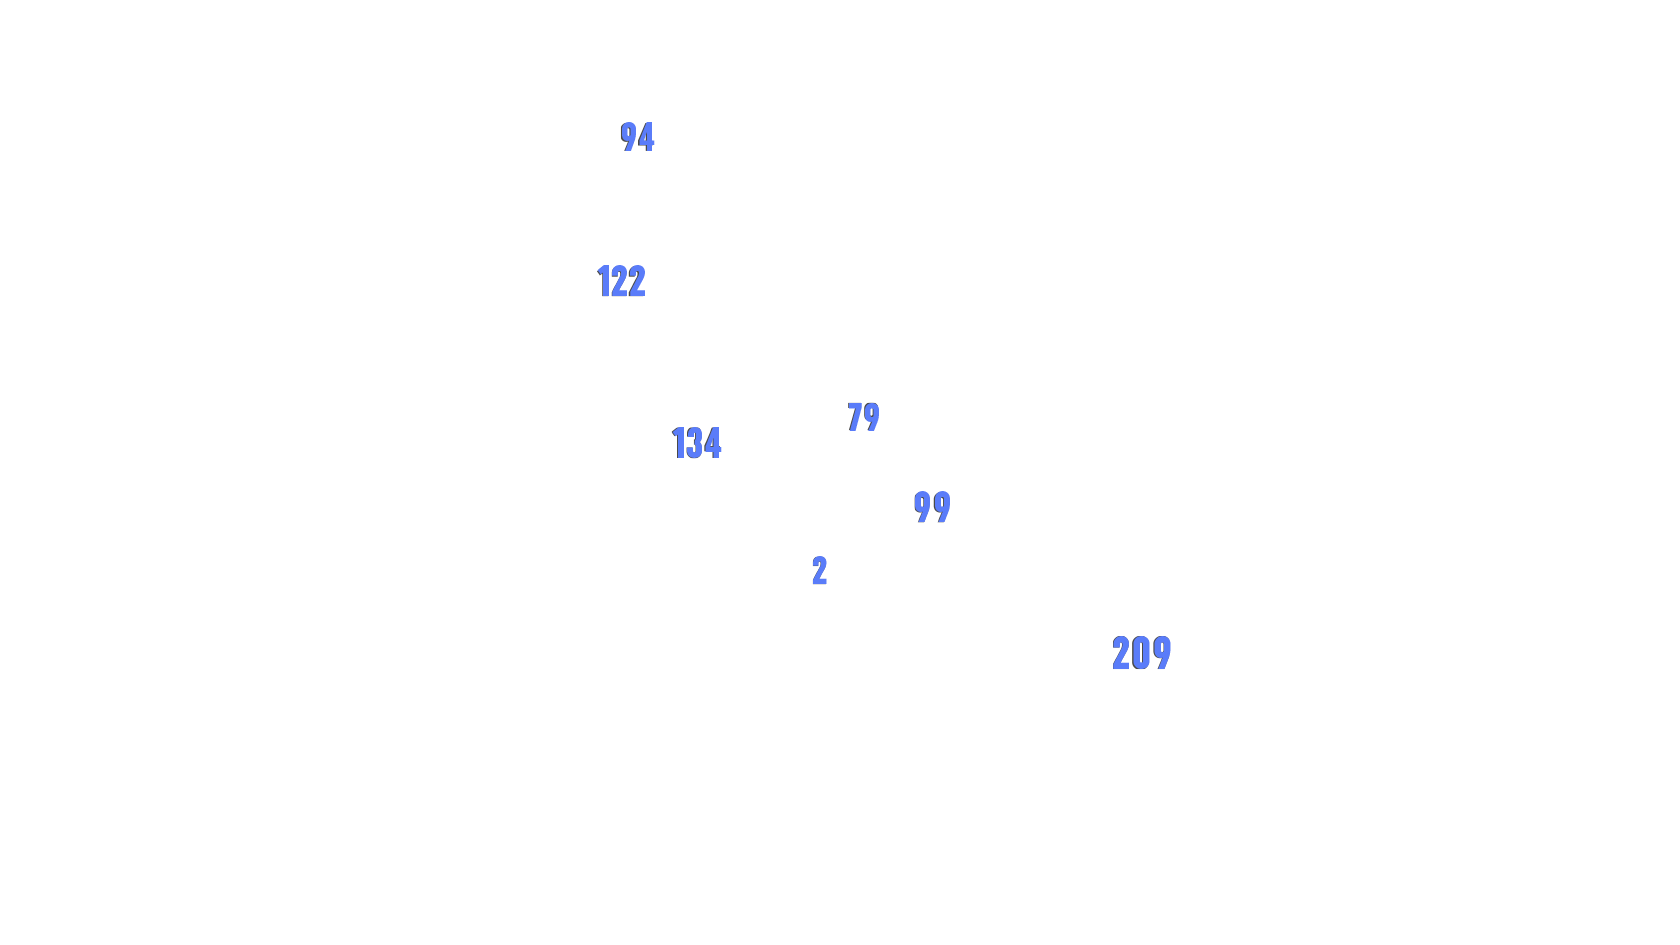

Asian and African migrants who most frequent these routes from Latin America heading north come from:
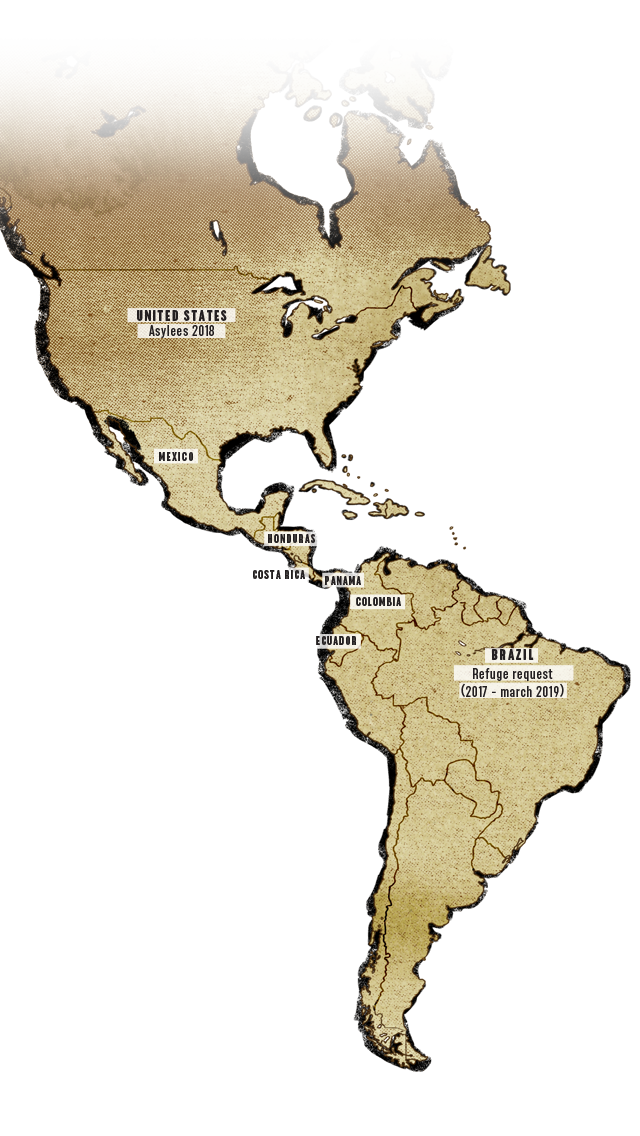
This map shows the flow of Asian and African migrants to North America, by the most frequent nationalities and as reported by each country when they are registered. It is constructed with the official statistics available in the public portals of some countries or from data that this journalistic alliance requested from their authorities.
Comments about the data and sources
This map shows the flow of Asian and African migrants to North America, by the most frequent nationalities and as reported by each country when they are registered. It is constructed with the official statistics available in the public portals of some countries or from data that this journalistic alliance requested from their authorities.
We originally obtained statistics from Brazil, Ecuador, Colombia, Panama, El Salvador, Honduras, Guatemala, Mexico and the United States. However, we excluded Guatemala from the interactive map because, although the National Directorate of Migration gave this alliance the data of people in an irregular migratory condition until 2014, its figures only registered a citizen of Cameroon in this situation. We also did not include El Salvador's figures on the interactive map because its figures and our reporting, indicate that its territory is no longer a main route for these migrants.
The user can click on a country and it will appear how the traffic flows from south to north. You will see that the numbers change from country to country, and sometimes it seems that people disappear from one country to another. This shows precisely how multiple and varied their travel routes are (not all pass through the same countries), how clandestine their journeys are (they do not always register with the authorities) and the dangers (some die or disappear on the road).
In more open countries, more migrants register their passports, but in more closed countries they go undetected. The leaps in numbers also occur because many are led by traffickers, who use their corrupting power to forge passports and buy authorities. Finally, since there is little coordination between entities in the countries, the figures reflect different data: for example, Mexico registers those presented to the immigration authority and Ecuador, the positive migration balance of those who entered the country, but did not register with migration posts their exit.
The reader should then take these figures, not as an exact figure of reality, but as an illustrative indicator of the magnitude of the flow (which we estimate to be between 13,000 and 24,000 people per year who travel irregularly trying to reach the North), its main routes, and the information gaps that exist.
This is the detail of the data sources:
BRAZIL
The port of entry for a large number of Asian and African migrants is Sao Paulo, Brazil. They arrive there and many ask for asylum or temporary residence, but many also continue their journey because they abandon their application, or lose patience due to the delay in resolving their situation, or simply always want to continue their journey north and the application was just a way of getting a foothold in America. Others do take refuge, but after two or three years they decide to try their luck in the countries of the north because Brazil did not give them what they expected.
Recently, the Brazilian authorities cleaned up their migration data - which are themselves very complex, since decisions on refugees are made by three bodies: the National Committee for Refugees (CONARE), the General Coordination of CONARE and the Ministry of Justice and Public Security, and the figures vary according to the sources.
The ones you see on the map are Refugee Applications from these nationalities from 2017 to March 2019, according to data available in this database downloadable from the Ministry of Justice page on May 19. Not all the Asian and African nationalities that have most requested refuge in Brazil in recent years (including Senegal and Syria) are in our selection because we only chose the data of those whose nationalities appear in the migration points of other countries going up north.
(In this UNHCR mapping and figure analysis project, CONARE and the Ministry of Justice can analyse CONARE's decisions on refugee claims from 2018 to January 2020. Thus, for example, out of 897 requests for refuge from Angolans studied by CONARE, only 27 were granted refuge)
ECUADOR
The other major gateway to Latin America for transcontinental migrants is Ecuador. It opened its doors to all nationals of any country in 2008, and although it now requires visas from nationals of several countries, it remains a fairly free entry point to the continent. We know this because we were told about it by the migrants we saw on the road, according to police and academic research consulted for these stories.
Ecuador, however, does not provide public data on "irregular" migration. The only way to measure it, the experts told us, is by looking at the migration balance. That is, people who normally stamped their passport upon entry, but leave without registering (most likely clandestinely). According to our analysis, if we take the figures from 2010 to 2019, the three countries that consistently had the highest migration balance were The Gambia, Eritrea and Senegal. But in the last year, the flow changed, and the highest balance was presented by Cameroon and India (but with the imposition of visas on these nationalities, this figure will probably be different by 2020).
The data we include in this interactive map is that of the nationalities with the highest migratory balance and which are detected again in significant numbers in countries towards the north. The source is the Ministry of Government Migration that publishes its data online.
COLOMBIA
According to the various sources we consulted, including experienced officials of Migration Colombia, Colombia has changed its policy on several occasions regarding the passage of migrants who travel to the north. For years it has prohibited them, forcing migrants to take more dangerous routes through the Orinoco plains, in Venezuela or going around via the Brazilian Amazon jungle.
Currently, and for more than a year, Colombia has generally allowed the transit of migrants to the north, giving them a pass to cross the country, according to migrants, in five days. The laissez-passer can be extended, but most transcontinental migrants do not know this, and do not even speak Spanish to understand the document they are given.
Colombia's figures for this type of migration are not publicly available. We requested this information to Migración Colombia, the agency of the Ministry of Foreign Affairs in charge of the issue. They gave us two types of data: migrants who were given safe passage documents in 2019, and migrants detected in Colombian territory in the same year. Many more were detected than those who were given official passage permits. For example, according to the Colombian Migration Analysis and Strategy Group, 1,300 Cameroonians were given safe conduct passes in 2019, but the press office of the same entity reported that 2,318 migrants of the same nationality were detected on Colombian territory. The difference with Bangladesh is even more dramatic, since only 196 Bangladeshis were given their safe conduct, but 703 people from that country were detected.
In the interactive map presented here, we take the data of the citizens of the twelve Asian and African nationalities that most frequently pass through Latin America heading north, who were detected in Colombian territory in 2019.
PANAMA
The data you will find in the table corresponds to the "Irregular Transit of Foreigners across the border with Colombia" in 2019, according to a document provided by the National Immigration Service of Panama.
Most of the migrants who entered through the Darien jungle on the border with Panama in 2019 were Haitians (10,510) and Cubans (3,276). In third place were Cameroonians (2,223) and Indians (2,089).
From the report we made, we know that migrants from Asia and Africa who are on their way to the United States also pass through the airports and ports of Panama. Testimonies were given to us by travellers connecting from Sao Paulo to Panama, others pointing to a route to Moscow-La Habana- Panama. And then they go by land to Costa Rica.
That is why, when they arrive in Costa Rica, although coming from the neighbouring country of Panama, there are significant increases of extra-continental migrants, compared to those who entered through Colombia. For example, 2,089 migrants entered from India via the Darien (border Colombia-Panama), and 2,572 entered Costa Rica. The almost 400 difference had to arrive to Panama by another route other than the Darien. The figure given by Panama as "Congo" is most probably wrong because it is registering 1,291 people as Congolese from Congo-Brazzaville, a figure that does not match the data from any neighbouring country. In contrast, the figure that gives as coming from the Democratic Republic of the Congo, where other countries do record high numbers, is very low. Perhaps the figure for those from the DRC who pass through Panama is closer to 1,291 than to the 163 officially registered.
Costa Rica
Perhaps the most organized and pragmatic country in managing the transit of migrants going north is Costa Rica. As soon as they enter its territory, it registers their data, finds out if there is a history and provides them with transportation to continue on to Nicaragua. Perhaps that is why it records high numbers of extra-continental migrants. People have to hide it because they know very possibly that they will pass through legally without being obstructed.
Since 2017, the number of entry and transit permits for extra-continental immigrants granted by Costa Rica increased from 5,985 to 30,899 in 2019. Last year it registered the highest number of immigrants with permits since the government introduced this practice in 2016.
The data found in the interactive map for this country, refers to entry and transit permits granted to Asian and African migrants in 2019 and the source of the data is the Directorate of Immigration and Foreigners.
Honduras
According to the National Institute of Migration of Honduras, until October 24, 2019, 27,979 immigrants in irregular condition passed through the country. The vast majority are Cubans (16,705).
However, it is striking that this country has very low figures compared to those who have been travelling from Costa Rica. As if they had disappeared there and were seen again in Mexico. This may indicate how clandestine the passage through Honduras and Guatemala is.
The data on the map that you see, reflects the passage of transcontinental migrants from these 12 countries through Honduras registered by the authorities in 2019 (until October 24). The largest group comes from Cameroon (2,572).
We asked for data from the Directorate of Attention to Migrants (DAMI) in El Salvador to see if the route that extra-continental migrants were taking to go north was not through Honduras, but through El Salvador. However, the list of all persons detained in an irregular migration status in 2019 only included one Bangladeshi man. And among all the people who had sought asylum or refuge in that country in 2019, there was not a single person from Africa or Asia.
Mexico
The data you see on the interactive map of Mexico is from the Migration Policy Unit-Government of Mexico and corresponds to the number of people of these twelve nationalities presented to the migration authority in 2019. It should be noted that the total number of migrants from these twelve countries reaches 13,000, a figure considerably higher than those registered in Honduras or Guatemala, and more similar to the 12,340 registered in Costa Rica.
The number of extra-continental migrants arriving in Mexico has been increasing since 2012. Consistently since 2016, and until today, migrants from India make up the largest group of migrants passing through to the United States or Canada.
UNITED STATES
Many of the migrants in this story are seeking to enter the United States, either to stay there or to continue to Canada. One way to get an idea of the flow coming from Latin America is to look at how many of the nationalities that give them affirmative asylum (when the person goes before a judge to ask for it) or defensive (when the person has been arrested at the border and tries to fight their deportation by presenting their case to the courts).
The data on the map corresponds to the sum of those granted asylum (defensive and affirmative) to persons of these nationalities in 2018, which is the most recent official data.
The data is online and is provided by the Department of Homeland Security. Many of those granted asylum had arrived several months earlier and had to wait until a judge decided their case.
Many more of those who are granted asylum apply for it. In 2017, 139 801 people of all nationalities applied for asylum, mostly from Mexico, Central America, Venezuela and China. Of the list of extra-continental immigrants who use the Latin American route the most in 2017 (the last year for which data are available) was India with 4,057 applications.
También muchos migrantes asiáticos y africanos son capturados en las fronteras de Estados Unidos, que han entrado al país sin permiso. En el 2018 capturaron a 9 953 ciudadanos de la India, 1 295 de Bangladesh, 775 de Nepal y 478 de Paquistán, entre otros. Siguen siendo una minoría en comparación con los mexicanos y los ciudadanos del Triángulo Norte.
Many Asian and African migrants are also caught at the borders of the United States, having entered the country without permission. In 2018, 9,953 citizens of India, 1,295 of Bangladesh, 775 of Nepal and 478 of Pakistan, among others, were captured. They remain a minority compared to Mexicans and citizens of the Northern Triangle.
In general terms, the sector with the most arrests of Africans in the last decade is the Rio Grande Valley, which suggests that it is a major transit point.
A complete analysis of refugees and asylees in the United States and their behavior in recent years can be found in Migration Policy
 Download Data